Top 10 Contact Center KPIs to Improve Customer Satisfaction
Want to keep your customers happy? Check out the top 10 Contact Center KPIs to track! Boost satisfaction and improve service with these easy tips!
Author: Aasritha Sai


Want to keep your customers happy? Check out the top 10 Contact Center KPIs to track! Boost satisfaction and improve service with these easy tips!
Author: Aasritha Sai
When running a call center, you know how one phone call can change everything. These things don’t just happen once. They happen every day if you’re not paying attention to the numbers that show how your calls are really going. To manage this well, you need to track something called KPIs. Key Performance Indicators or KPIs are the important numbers that tell you what’s working and what’s not.
In this blog, you’ll learn about the 10 most useful KPIs that can help you fix problems faster, support your agents better, and make sure your customers stay satisfied after every call.
Contact Center KPIs help you understand how well your team is supporting customers and where they can improve. In this section, you’ll see how KPIs shape customer experience, where teams often go wrong, and why real-time updates help you fix small problems before they slow your team down.
When a customer reaches out, they remember how they were treated, not just how fast their problem was fixed. That is why tracking the right customer experience metrics matters. Numbers like first reply time, how quickly issues are solved, and how happy customers feel tell you what kind of experience your customers are actually having.
Many businesses make mistakes when tracking Contact Center KPIs because they don’t focus on the customer’s real experience. They care more about call volume, like how quickly calls are answered or how many tickets are closed, instead of checking if the customer was truly happy.
Some teams also track too many numbers at once, which makes it hard to know what is actually useful. If the data is not clear or fresh, it can lead to the wrong decisions.
Another mistake is watching the numbers but not using them to make things better. Contact Center KPIs only help when you use them to improve how your team works and how your customers feel.
KPIs help you see how well your team is doing and how happy your customers are. With the right numbers, you can quickly find out where your team can do better and make sure your customers are happy with the service. Here are the benefits:

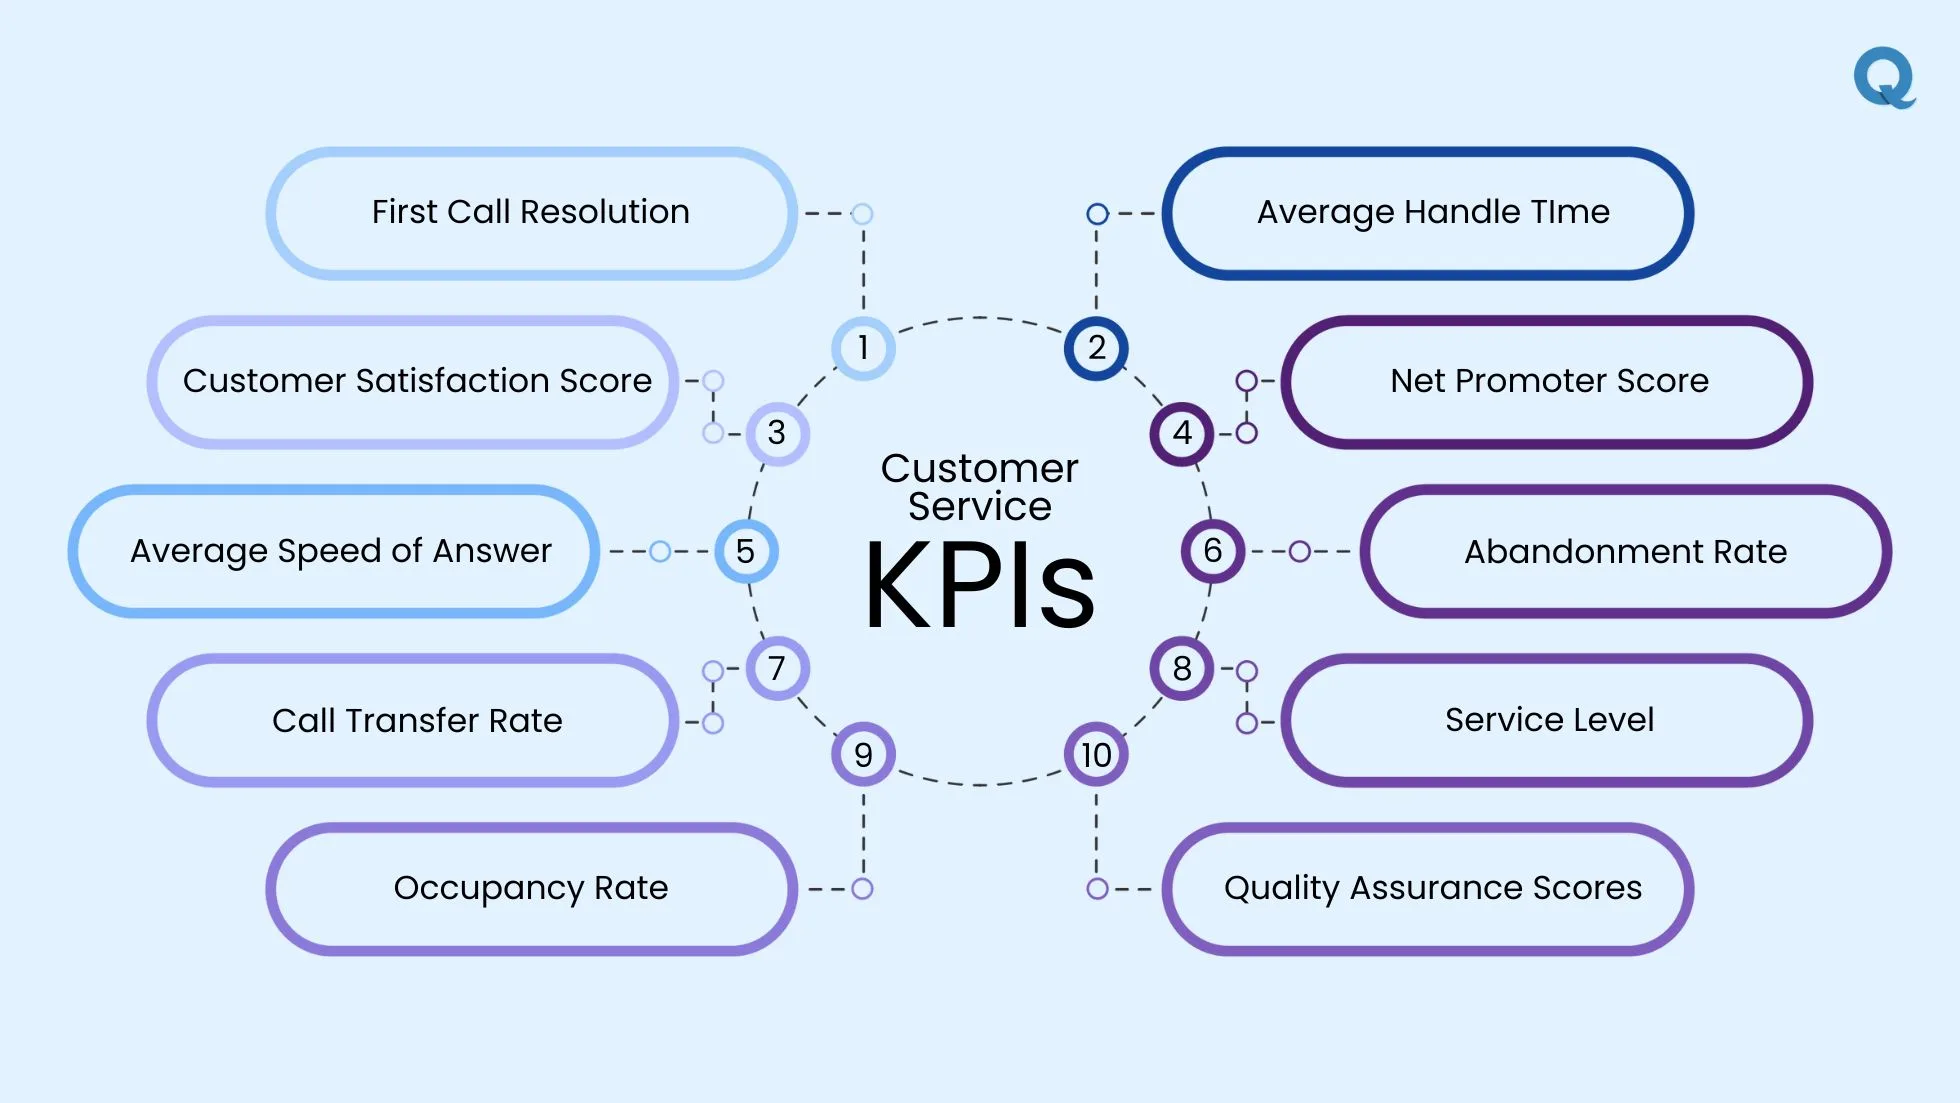
Tracking KPIs helps call centers know what’s working and what needs to improve. In this section, we’ll check out 10 important KPIs that help call centers understand their strengths and offer better service. Let’s look at these KPIs and see how they can help your call center’s performance and make your customers happy.
First Call Resolution measures how effectively customer issues are resolved during their first contact with your support team. Whether it’s over the phone, chat, or email, FCR focuses on solving the customer's problem in one interaction. A high FCR rate means your team is handling inquiries efficiently, saving time for both customers and your business. When issues are resolved on the first contact, customers feel their time is respected. First Contact Resolution strengthens customers' trust in your brand, and reduces the need for follow-up interactions.
To calculate FCR, use the following formula:
Once you calculate the FCR score, you can categorize customer responses into the following groups:
Average Handling Time is a key customer service KPI that tracks the time agents
take to manage a customer interaction, including talk time, hold time, and after-call work. It helps assess
the efficiency of your call center. A lower AHT indicates faster resolutions, but balancing speed with quality
is essential.
AHT is directly linked to customer satisfaction. Customers prefer quick resolutions, and reducing their wait
time can greatly enhance their experience. Effectively managing AHT can lead to happier customers, increased
loyalty, and a more efficient call center.
AHT is calculated using this formula:
Customer response based on AHT score:
Customer Satisfaction Score measures how satisfied customers are after a service interaction, typically handled by a call center. It’s collected using a customer satisfaction questionnaire that asks a simple question like “How satisfied were you with the service?” This score is a key customer service KPI that gives you a quick view of how well your team is performing.
CSAT = (Number of Satisfied Responses / Total Responses) × 100
Once you calculate your CSAT, you can categorize it like this:
Net Promoter Score (NPS) tells how likely customers are to recommend your service. It reflects overall satisfaction and loyalty. In a call center, NPS supports tracking service level and call quality while also giving insight into key call center metrics. A high score means happy customers who promote your brand, while a low score shows gaps needing attention.
To calculate NPS, ask customers to rate their likelihood of recommending your service on a scale from 0 to 10. Then, categorize the responses and apply the formula:
Customer responses are grouped like this:
The Average Speed of Answer (ASA) measures how quickly your team answers incoming calls or inquiries. A lower ASA means that customers spend less time waiting for a call to be answered, leading to a better experience and increased satisfaction. When there is minimal wait time, satisfaction rises, which directly boosts loyalty to your business.
To calculate ASA, use the following formula:
Based on the ASA score, responses can be categorized as follows:
Abandonment Rate tracks how many calls or interactions are abandoned by customers before they are resolved. This can happen when customers hang up or leave the chat, often due to long wait times or poor service. Understanding your call abandonment rate helps you identify areas where customer satisfaction can be improved. Reducing abandonment leads to better customer retention and loyalty.
To calculate the call abandonment rate, use the following formula:
Once you calculate the abandonment rate, you can categorize customer responses as follows:
Call Transfer Rate shows how often a customer call is transferred from one agent to another before being resolved. If calls are transferred too many times, customers may feel frustrated and unheard. A low call transfer rate means your team is trained well and customers get the right help without delay. This reduces calls divert frustration and leads to a better support experience.
Call Transfer Rate = (Number of Calls Transferred / Total Number of Calls) × 100
Based on the score, customer response can be categorized as:
Service level shows how quickly your support team responds to customer requests, whether it's calls, chats, or emails. It’s a key measure of service quality, reflecting your team’s ability to meet customer expectations within a set time. A higher service level leads to quicker support, shorter wait times, and happier customers. When customers get fast help, they feel valued, boosting trust and satisfaction.
Service Level = (Number of Calls Answered Within Target Time / Total Calls Received) × 100
Once you get the score, you can group the service level performance like this:
Occupancy Rate shows how much time your agents spend working with customers or finishing tasks after a call. If it’s too high, agents get tired and service quality drops. If it’s too low, time and money are wasted. A balanced rate improves agent performance, reduces agent spends, and highlights where agent training is needed.
Occupancy Rate = (Talk Time + After Call Work) ÷ Total Login Time × 100
Here’s how to understand the score:
Quality Assurance (QA) Scores show how well your support team follows company standards during each call, chat, or email. It’s like checking the quality of every customer interaction. When you keep QA scores high, you’re not just following rules. You’re building real trust with your customers. This improves service quality, increases real time satisfaction, and reduces the chance of customers needing a call back.
QA Score = (Total Score from Evaluated Interactions / Total Possible Score) × 100
Once you calculate the QA score, you can understand how customers are likely feeling based on the score range:
Choosing the right KPIs starts with knowing what matters most to your team’s goals and customer expectations. You need metrics that clearly reflect your call center’s ability to fix issues and improve performance.
Last chance! Get 30% off all Qoli features before this limited-time deal disappears forever.
When you track the right KPIs, you can improve your call center in ways that truly matter to your team and your customers. These numbers help you see where your service is strong and where improvements can be made. By paying attention to what affects customer satisfaction, you’ll solve problems faster, support your agents better, and boost overall call center performance. To build a service that runs smoothly and keeps customers coming back, start by focusing on the KPIs that guide smart decisions every day.